2026 Website
Trade-In Event
Exclusive discounts await on our best real estate website packages.
Get A New Website Today!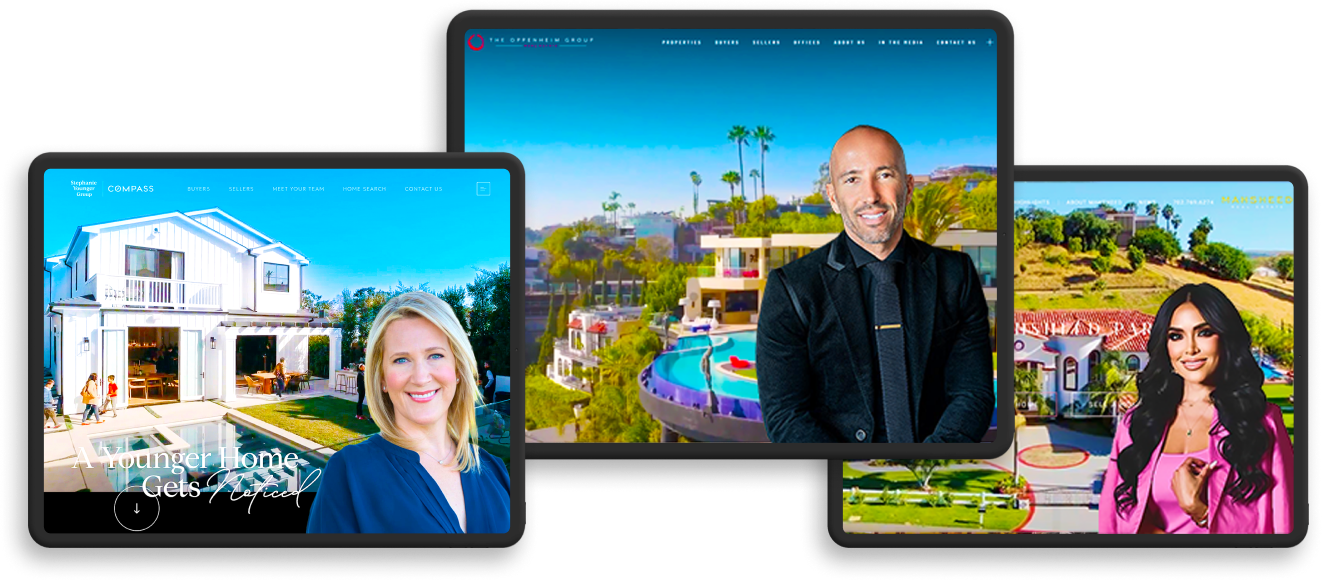
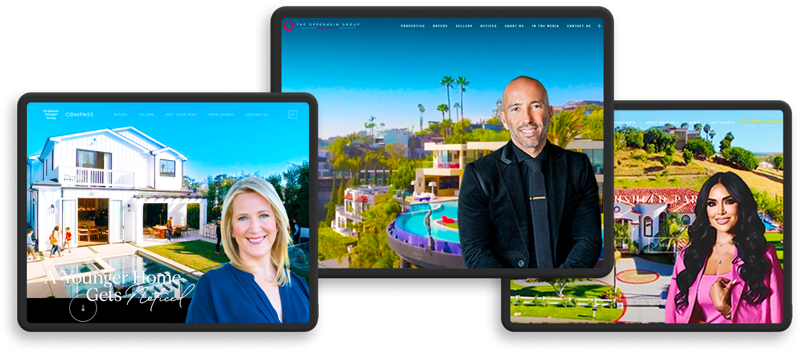


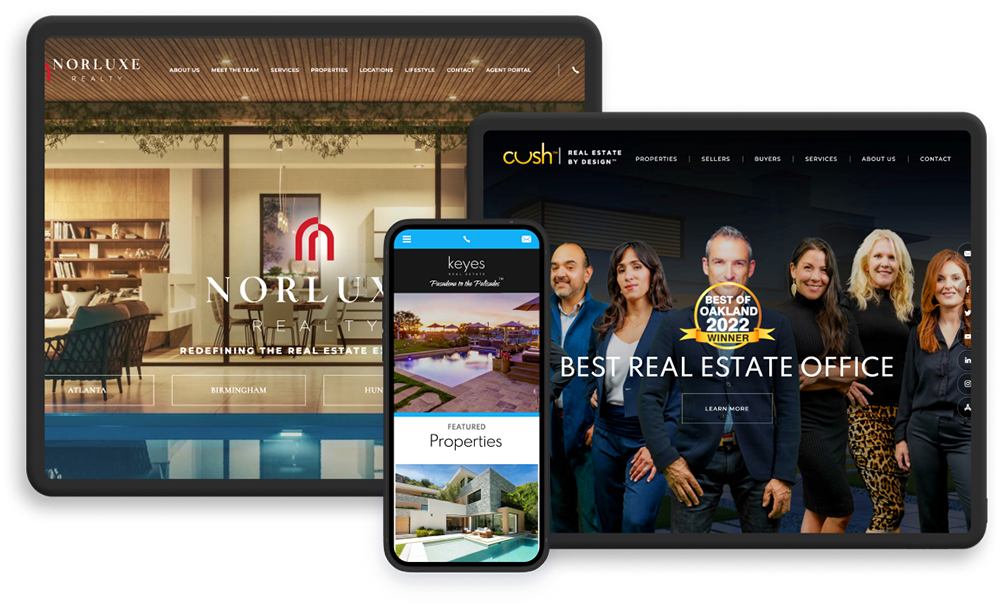
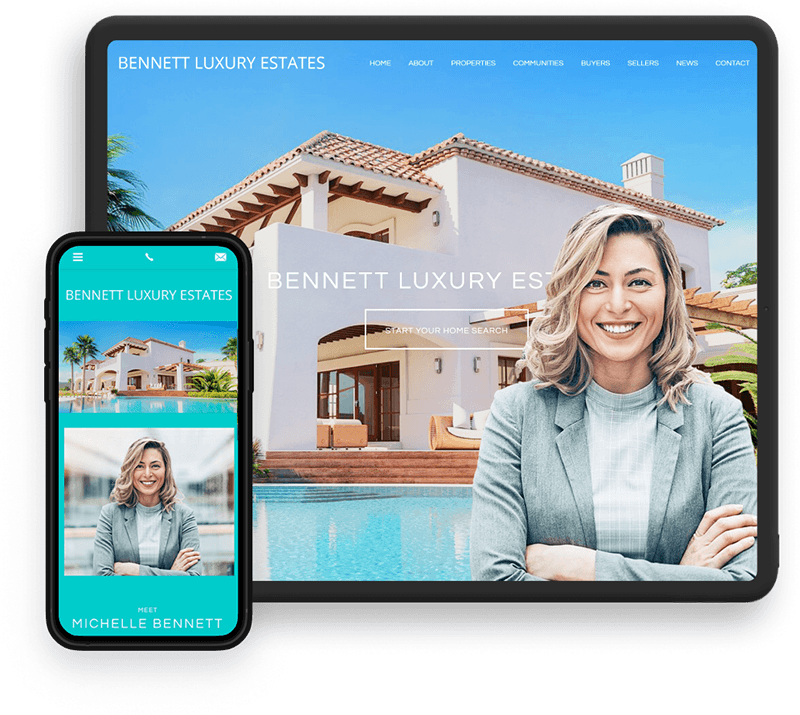
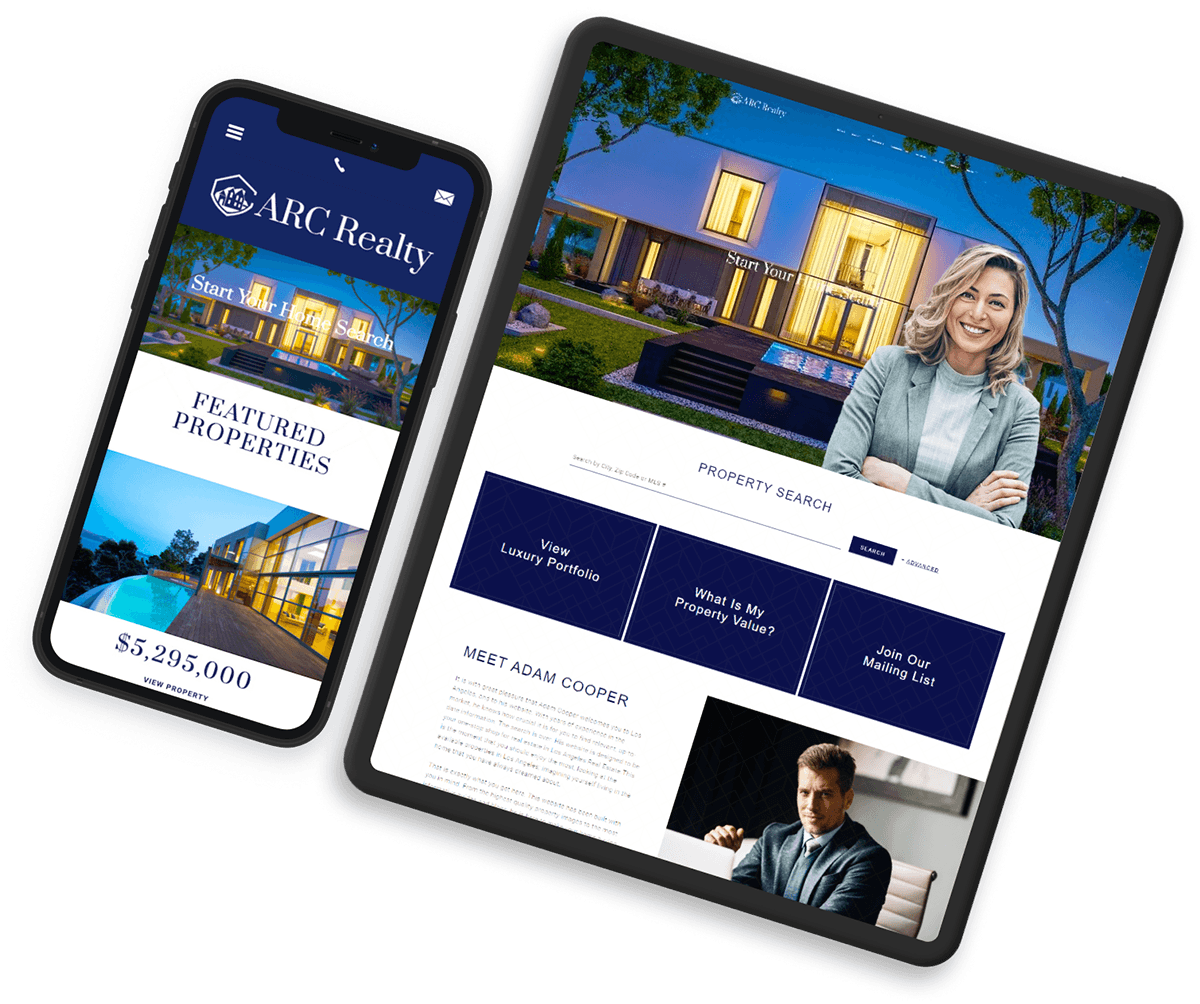
Award-WinningReal Estate Agent Websites
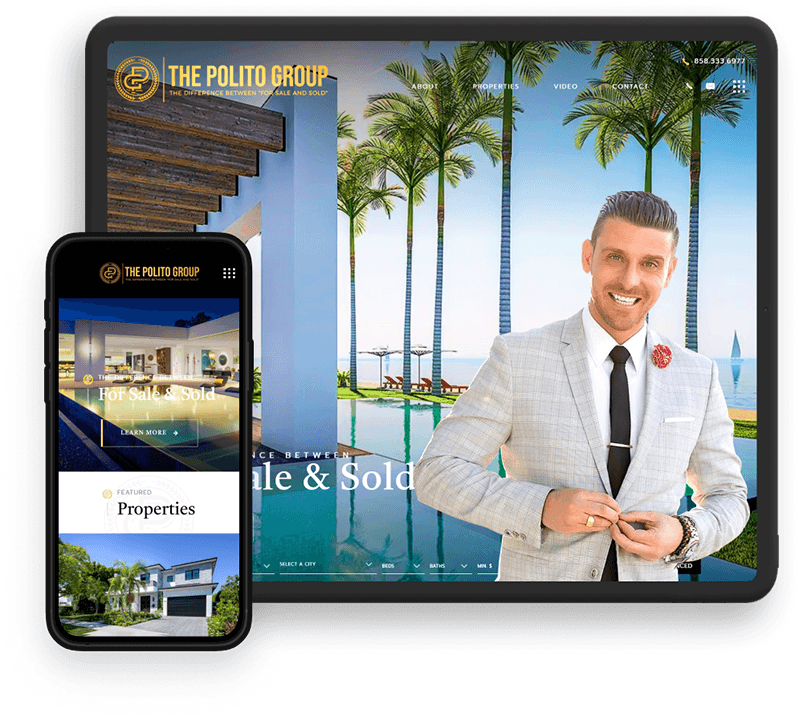
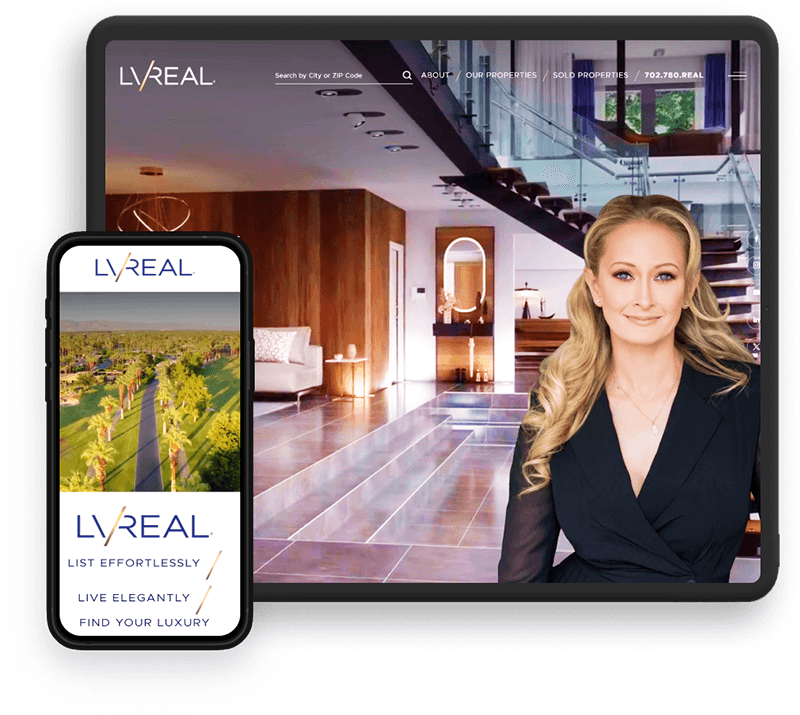
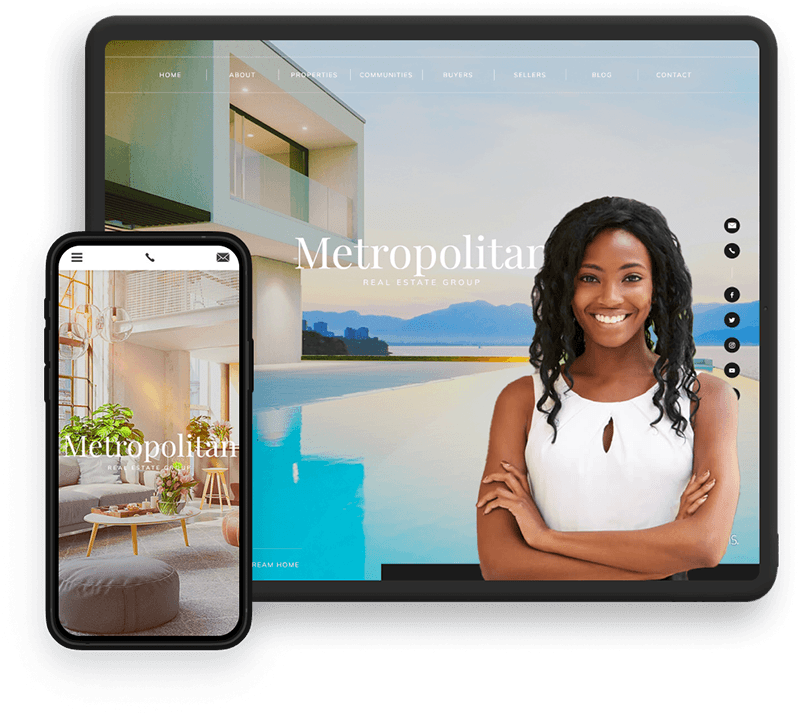
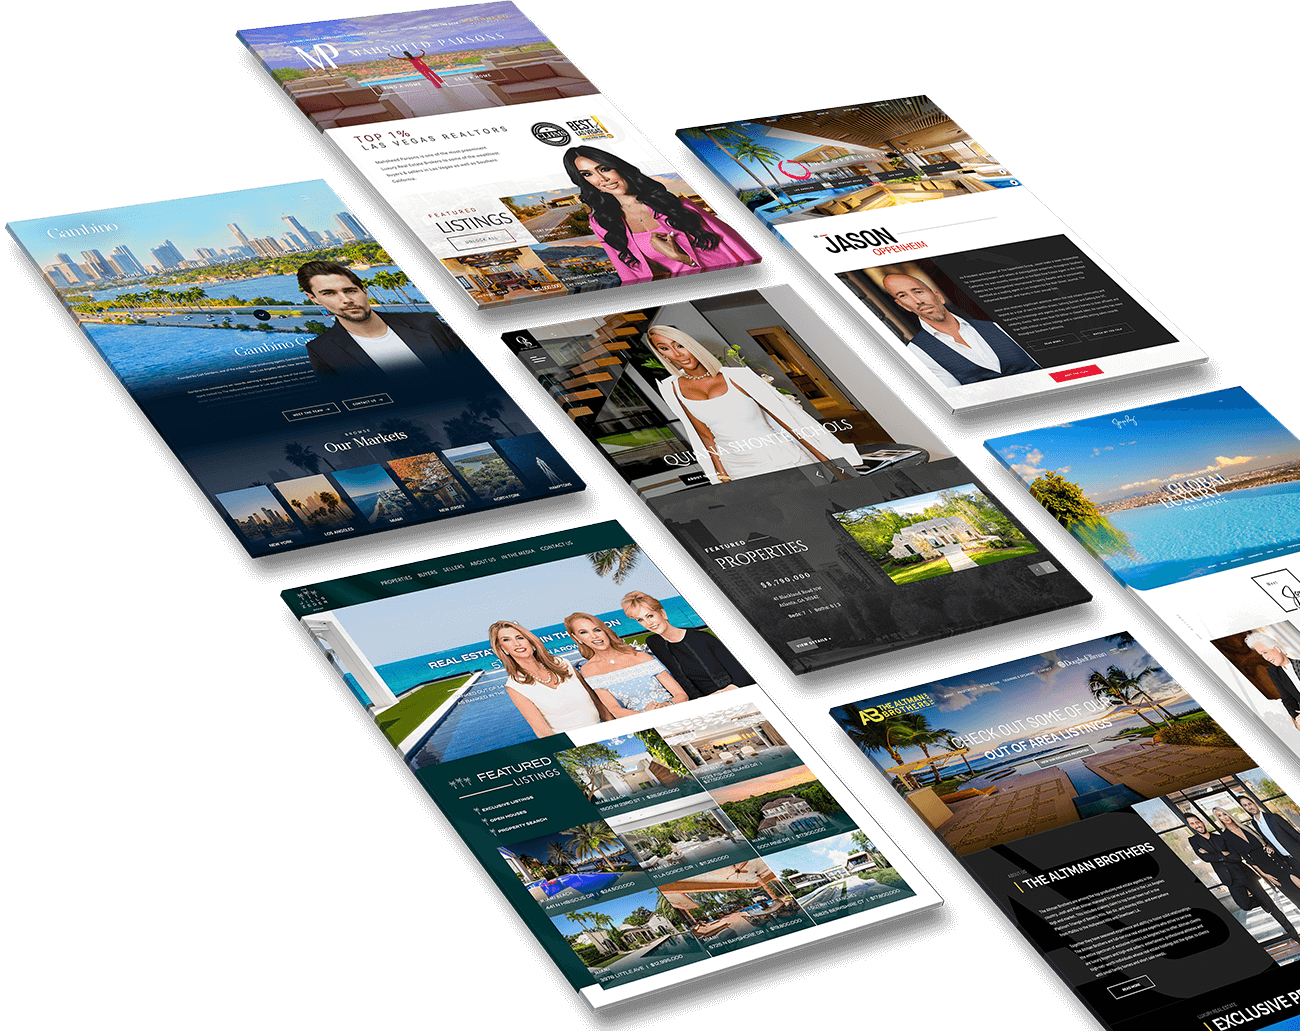
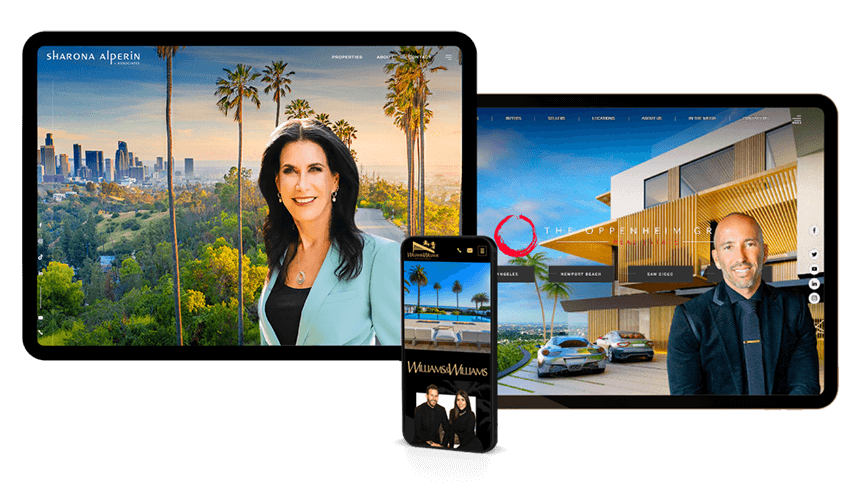
Lead generation has never looked this stunning.Join Agent Image's long list of elite clients who rely on our design skills to get ahead of the game.
-
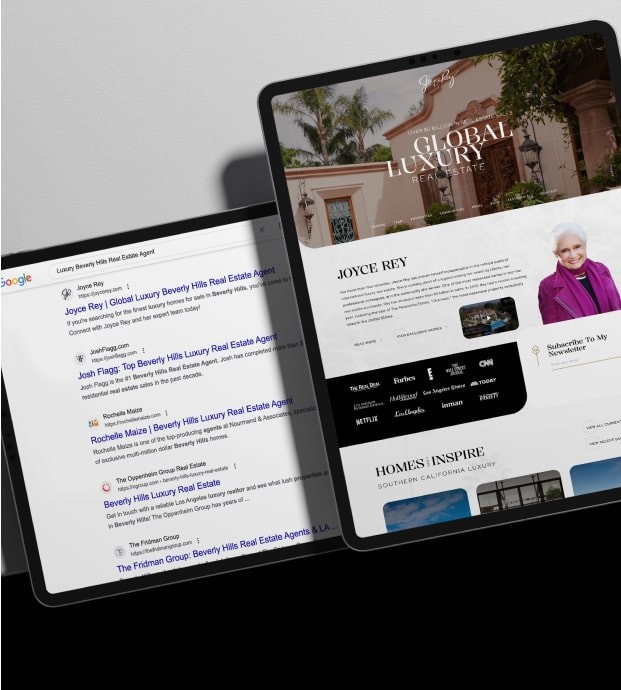
The Oppenheim Group
-
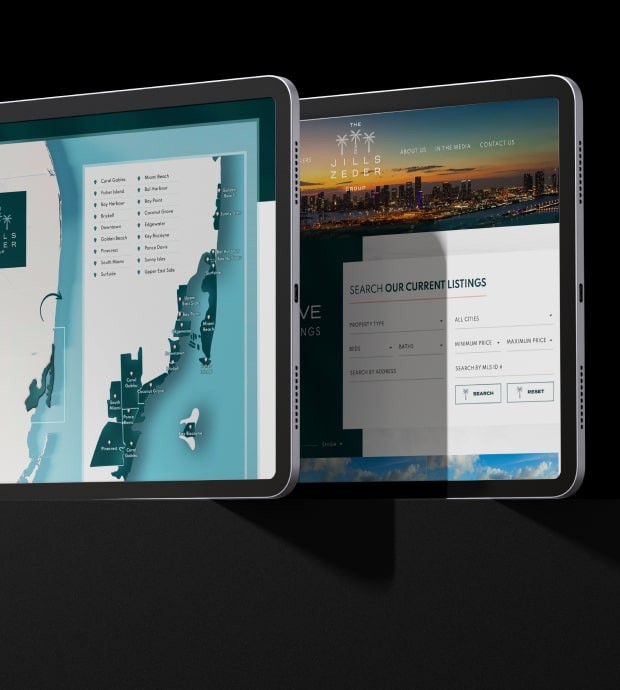
The Jills Zeder Group
-
The Altman Brothers
-
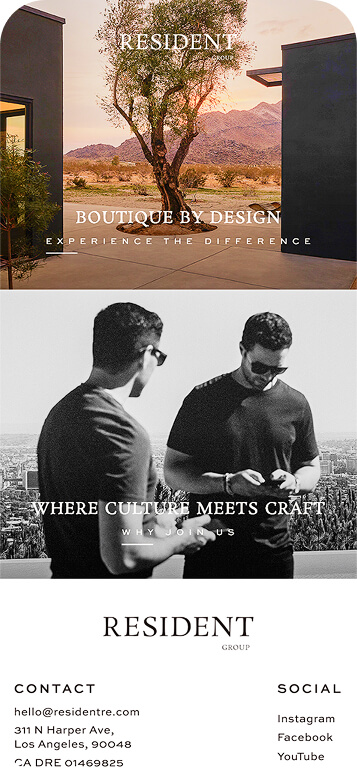
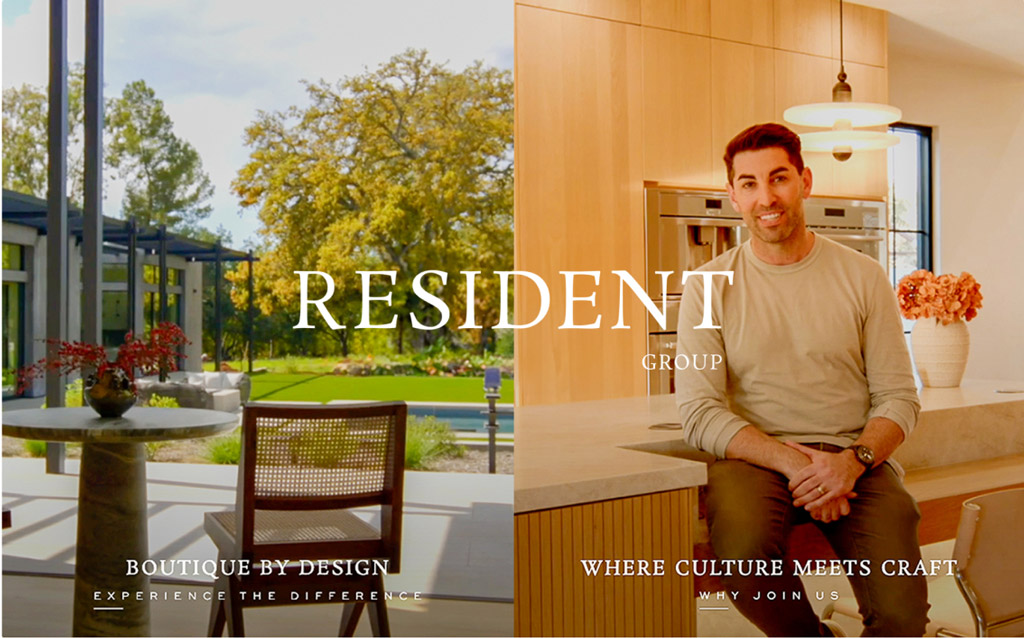
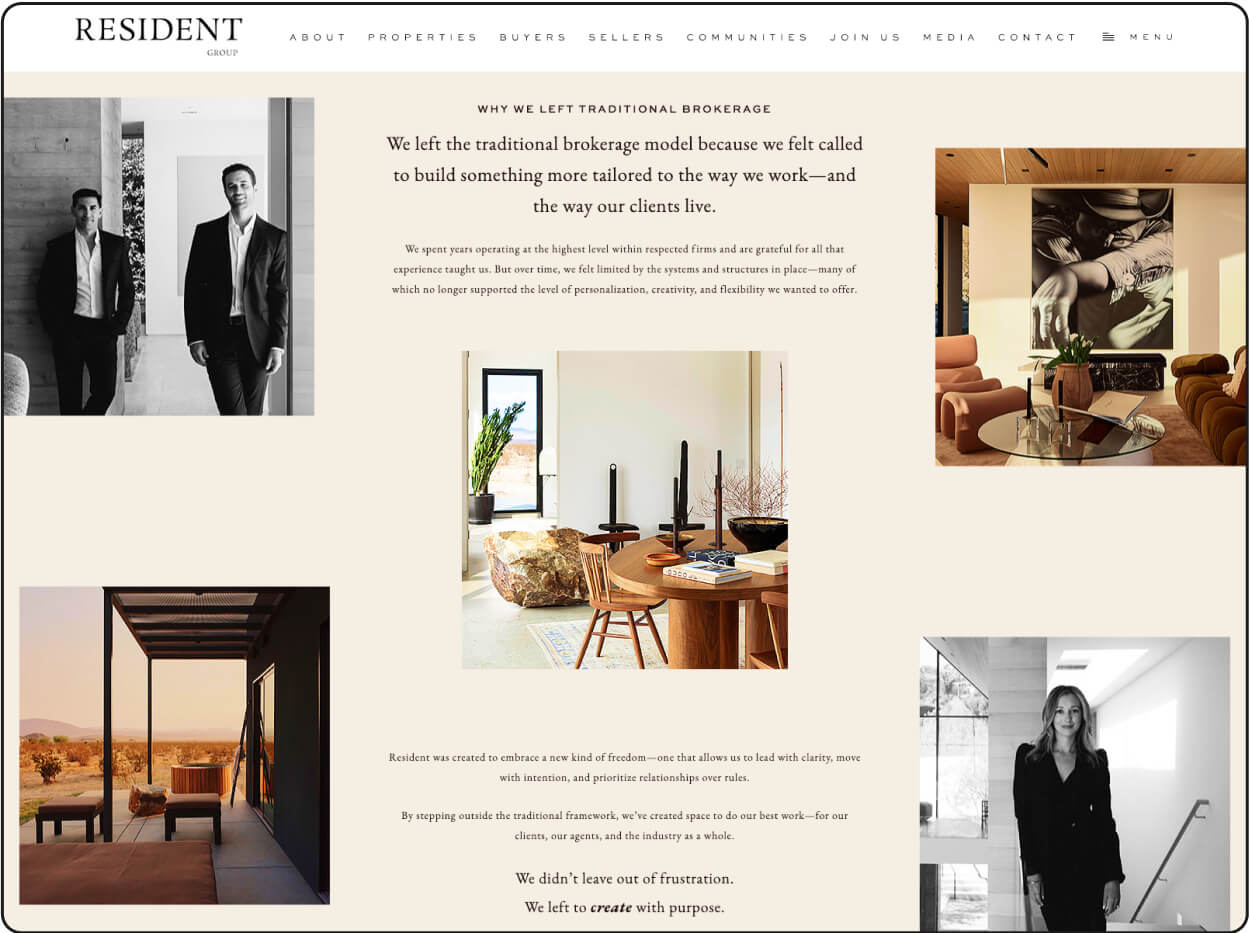
Resident Group
-
Dolly Lenz
-
Mahsheed Luxury Real Estate
-
Kofi Nartey
-
Joyce Rey
-
Williams & Williams


Dominate in style with our
website designs
Designed for Distinction.
-
Imagine Studio
-
Imagine Studio
The Imagine Studio package is for real estate agents and brokerages who require a higher level of custom design.
- Best for real estate agents, teams, and brokerages who are leading the market and want a trendsetting website that brings to life their unique vision.
- A custom-designed home page and three inner pages
-

-
-
Semi-Custom
-
Semi-Custom
Hands down, our most popular website. Combine the ease of a website theme with the customization you need for your agent brand.
- Built for professionals or teams who want the freedom to create a unique website that showcases their brand and generates leads
- Comes with lead generate and capture functionality
- SEO optimized to boost your search engine rankings
-

-
-
Agent Pro
-
Agent Pro
Get access to a broader selection of beautiful themes that come with useful features straight out of the box.
- Built for go-getter agents who want a great-looking website ASAP.
- IDX integration using the vendor of your choice
- Built-in loan and amortization calculators plus customizable autoresponder
-

-
-
Agent Image X
-
Agent Image X
A theme-based package whose upscale design options look anything but entry-level.
- Ideal for agents who want a quick and easy website that doesn’t scrimp on style
- Choose from eight professionally designed themes
- Mobile-optimized design for easy viewing on the go
-

-
-
Brokerage
-
Broker Solutions
Scalable brokerage website solutions to increase brand visibility and generate leads.
- Custom website design that aligns with your brand
- IDX Compatible with custom options to scale your business in multiple markets
- Multiple integration options for chat, CRM, lead gen and more!
-
-
Digital Marketing Sharpen Your Online Edge
Why chase the competition when you can beat it? Our full suite of real estate marketing services helps you engage your market, generate quality leads, and boost brand visibility on traditional search and AI-powered platforms alike.
IDX
Supercharge your real estate business with cutting-edge IDX solutions.
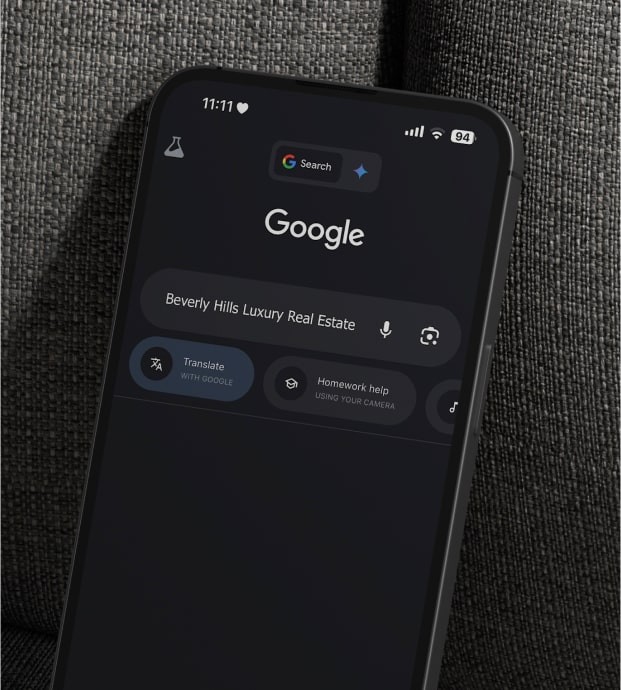
SEO + AEO/GEO
Be the first result clients see and the first name they trust across search engines, AI platforms, and beyond.
PPC
No click, no pay. It’s the smartest, most cost-effective way to advertise online.

What’s The Right Website For Me?
Take our short quiz to help you choose the right website.
Whether you’re a rookie or a rockstar agent,
there’s a perfect website
package for you.

How big is your company?
Select one below
Find the best match
Compare Websites
- Custom Homepage
- Custom Inner Pages
- Premium Website Customization
- Custom Real Estate Tools
- Custom Add-Ons
teams who want greater design freedom
- Custom Homepage
-
Matching Design for
Inner Pages - Advanced Website Customization
- Custom Real Estate Tools
- Custom Add-Ons
your online presence.
individual agents and
small teams
- Predesigned Homepage
- Predesigned Inner Pages
- Basic Website Customization
- Custom Real Estate Tools
- Custom Add-Ons
never looked this good.
individual real estate agents
- Predesigned Homepage
- Predesigned Inner Pages
- Basic Website Customization
- Custom Real Estate Tools
- Custom Add-Ons

Questions about our website packages?
We're all ears!
No obligation, no pressure, no risk — just a chat to understand your needs.
Service Sets Us Apart Satisfaction comes standard
26 years of expertise in shaping the industry. Five-star results and thousands of
reviews.
We'll let our clients do the talking.


Jason Oppenheim
ogroup.com

Brandi Pratt
delanogroupre.com
Ivan Estrada
www.ivanestradaproperties.com
Award-Winning Websites A Legacy of Great Design
Our trove of accolades should tell you one thing: we know what it takes to make websites for the world’s top real estate professionals. If it’s an award recognizing exquisite design, we’ve got it under our belt.
View all our awards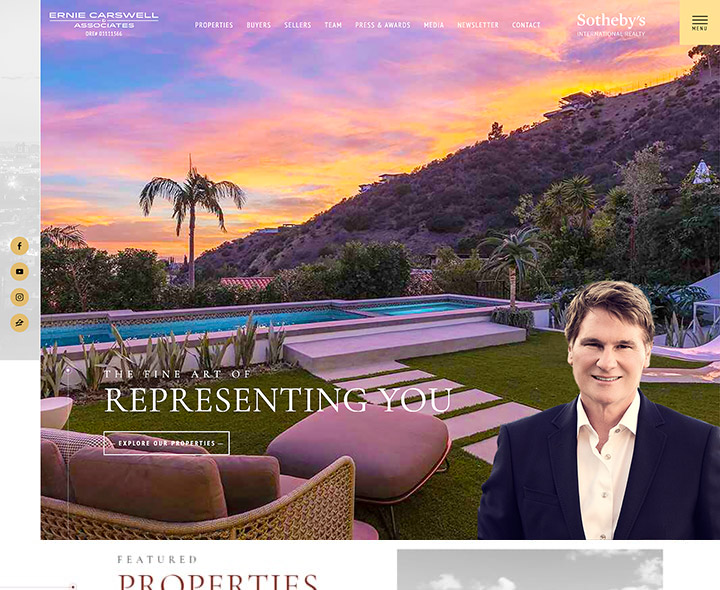


In Prestigious Company The Who’s Who of Real Estate
You are who you know. Our close relationship with distinguished organizations and individuals grants you access to the latest industry insights and best practices.


On Top of Trends and
Industry Insights
On-The-Scene Events
Want to know the latest trends in real estate marketing? Agent Image brings you events that bring together the brightest minds in the industry.
Learn About Events


It’s all about results.
Success Loves
Company
Follow us on social media!