Heat Maps: Learn How Visitors Interact with Your Site
So how effective is your website in terms of layout and user appeal? After your website is launched and you've spent some time marketing your services online, then it's time to make use of the analytics tools that you signed up for.
- First, you need to know if people are visiting your site. This you can do by using popular tools like Google Analytics. This tool shows how many users visit your site, their locations, page visits, keyword searches and other important data. This is not enough, however. You also need to know how users are actually navigating your homepage and what areas or buttons people often click first or which areas they stay on the longest.
- As a business owner and marketer, you have to know what areas potential clients consider important in your agent website. And with the help of behavioral metrics, you can then optimize your landing pages based on how users interact with your website with the use of heat maps.
Heat Maps
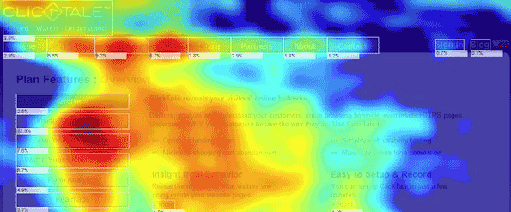
Like in the movies where a SWAT team uses thermal imaging devices, you can also track your websites' "hot spots". A heat map is a tool used by web designers and marketing experts to determine effective placement for call to action buttons, forms, banner ads, shopping carts and other web elements of importance. They are basically a visual report wherein the brightest colors represent the areas which get the highest visitor clicks and areas your a visitor's eye is drawn to.
First, you need to sign up for a heat map analytics tool like Crazy Egg or Click Density so you can add your page or sites which you want to track. Once the generated code is pasted on your page, the visual heat map report shows the specific buttons or hyperlinks that users frequently click on when they visit your site. A similar Scroll Map tool also exists, that shows you how far your users scroll down on your site.
- You may consider removing or editing the cold spots or unnecessary parts of a webpage as indicated on the heat map.
- Since scroll maps indicate the base line at which your web visitors stop reading, you can remove or reposition the important information found at the bottom of your site.
There are many heat map tools out there that you can use but here's a few to check out: Crazy Egg, Click Density, Click Heat, Click Tale, Inspectlet.
For more tips, watch out for our next issues and Like us on our Facebook page.